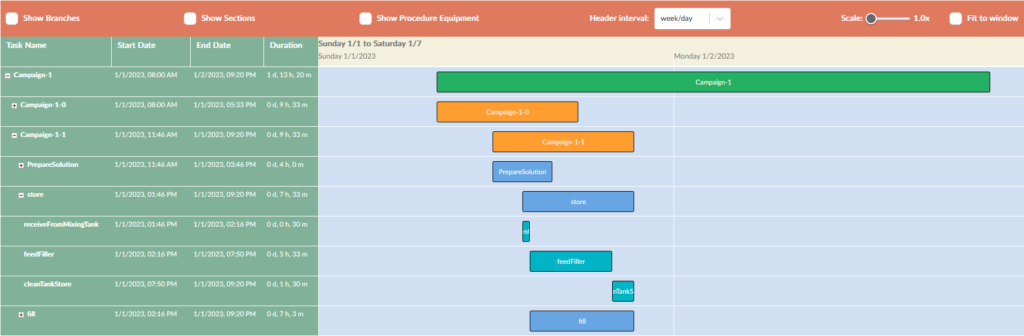
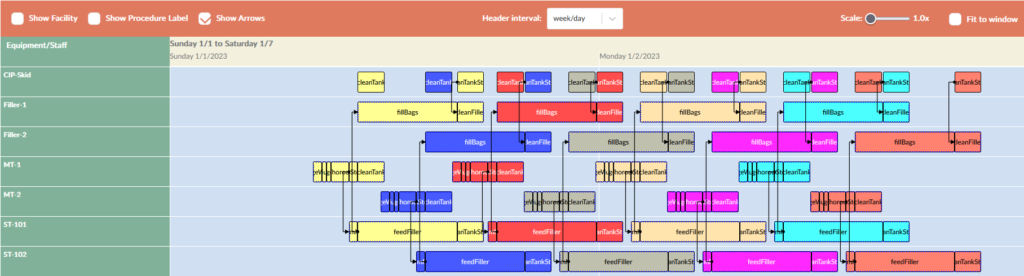
Created a javascript Gantt chart library based on React, which can be used both as a Gantt chart (process perspective) as well as a Scheduler component (resource perspective). The Gantt chart component relies on React rendering only for the subset of the functionality that involves: adding or removing elements from the DOM (e.g. data change, row expand/collapse, header date format), and changing chart options from the parent component via props (e.g. zoom level). For the rest of its functionality (e.g. column resizing, scrolling, adapting to window size changes), the component directly manipulates the DOM internally, in order to achieve higher performance by avoiding renders when possible. As most Gantt components, our library displays a grid with the task names and other pertinent information on the left-hand side, and a horizontal bar chart on the right-hand side.
Functionality at a glance:
- Multiple, resizable columns within the right-hand-side grid.
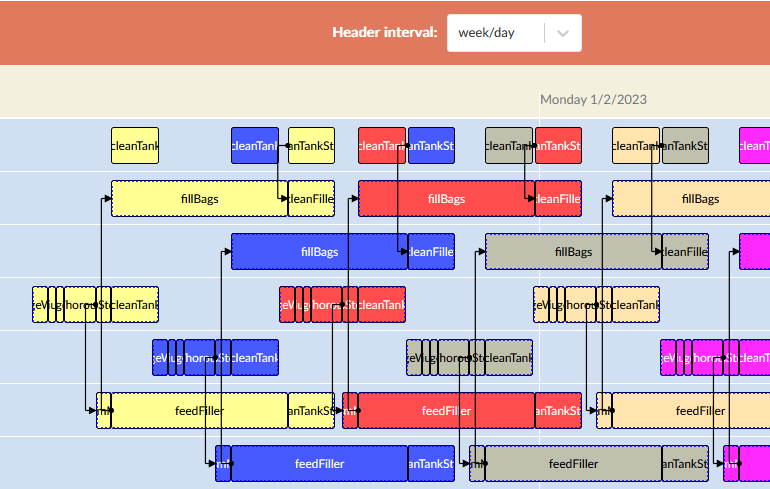
- Multi-level, nested tasks and bars with expand/collapse support.
- Svg arrows to denote task dependency between chart bars.
- Separator dragging for resizing the tasks grid vs the bar chart widths.
- A number of built-in date intervals for the bar chart time axis.
- View scale 1x to 100x (at 1x the chart stretches on the entire screen).
- Fit-to-window mode: fixes view scale to 1x and select the appropriate header interval.
- Relative time mode: Time units can be displayed relatively to the start of the data.
- Provides mechanisms for saving the chart state to the local storage so that the chart remains the same across refreshes. The chart state includes expanded rows, column sizes, central resizer position, vertical scrolling, horizontal scrolling, header selection, etc.
- Drag-and-drop functionality for moving tasks vertically (shift tasks in time) or horizontally (change the task order or resource assignment).
Technical highlights:
- Handles most user interaction internally, directly manipulating DOM elements via refs, while notifying the parent of resulting changes via callbacks (e.g. when resizing or scrolling).
- Uses an elaborate layout of divs and javascript events to support sticky headers, independent horizontal scrolling, synchronized vertical scrolling, column resizing and central resizer dragging.
- Accepts content props for chart data, start/end, columns, row status, view scale, fit-to-window, arrows, header selection. A change in these props causes a chart re-render.
- Accepts initial state props for column widths, central resizer position, row status (expanded/collapsed), horizontal scroll position. Subsequent changes to those props are ignored (no re-render is done) by exporting a React.memo with the appropriate areEqual function.
- Accepts update callbacks for notifying the parent on changes with column widths, row status, task list width, scroll position. Redundant renders are avoided by using useCallback in the parent component.
- Uses memos, when possible, to avoid costly recalculations when relevant props remain unchanged.
- Uses resize observers for adjusting chart sizes to the available space.