The presented functionality is part of the SchedulePro WebViewer web application, a product created on behalf of Intelligen Inc. in order to monitor production schedule in process-based production plants. The application is currently used for running the operations in several well-known, multi-national pharmaceutical companies across the globe. The application was built gradually during the course of almost ten years, thereby encompassing a number of different technologies that were becoming popular as the application evolved.
Building the WebViewer took place in three distinct phases:
- Phase 1: A Web Forms application was created from scratch, providing most of its functionality via the ReportViewer control in the Microsoft.Reporting.WebForms namespace.
- Phase 2: The back-end was extended with Web API functionality and the front-end was developed using various libraries such as JQuery and Knockout.
- Phase 3: A React build pipeline was integrated into the solution (link to blog post) and new functionality was implemented in the form of React components (link to Web Forms/React integration).
This is functionality created as part of phase 2 of the WebViewer development.
Functionality at a glance:
- Four main pages including: a Gantt chart, an equipment occupancy chart, an inventory chart and a schedule report.
- All pages include a collapsible data selection/filtering panel at the top and a chart or tabular report at the bottom, displaying the selected data.
- Between the top panel and the data several display options are presented in the form of a menu bar.
- Charts can be saved as images and reports can be saved in .pdf or .csv format.
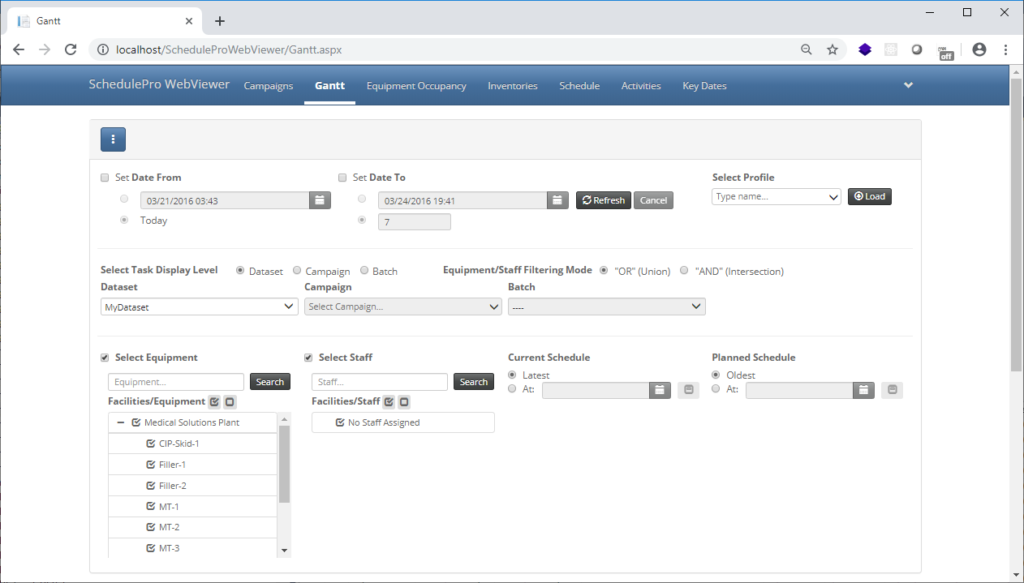
- The data selection/filtering panel employees date/time controls for absolute or relative date selection, combo boxes with synchronous or asynchronous search, tree views for multiple resource selection and modes of filtering criteria.
- All client-side application state is saved in local storage and restored after every page reload for seamless user navigation.
Technical highlights:
- Communication of the front-end with the back-end takes place via a Web API controller. Actions are async and cancellable through a framework-provided cancellation token.
- Database access is facilitated by Entity Framework. All queries are asynchronous and cancelable.
- Optional Windows Authentication is used.
The panel is implemented using Javascript and JQuery as well as a number of smaller libraries such as jquery-ui-timepicker-addon, selectize.js, spin.js, bootstrap-notify.js, and jspdf. The panel is displayed in the following screenshot:
The Gantt chart utilizes Javascript/JQuery and a heavily customized version of the DXHTML library. The chart is displayed in the next screenshot (the top panel is collapsed):
The equipment occupancy chart also utilizes Javascript/JQuery and a heavily customized version of the DXHTML library. The chart is displayed in the next screenshot (the top panel is collapsed):

The inventory chart utilizes Javascript/JQuery and a chart based on the Flot charting library. It includes a number of enhancements over the default chart (e.g. zoom bar, line visibility check boxes, overview map). The following screenshot depicts the inventory chart:

The report and paging functionality follows the MVVM pattern and utilizes the Knockout.js library. The next screenshot contains the tabular report with paging and sorting options:


